D.C. Metro Area
Creative + Strategy
GARY@G5DESIGN.NET
Senior Creative Director
Your Custom Text Here

Your Custom Text Here
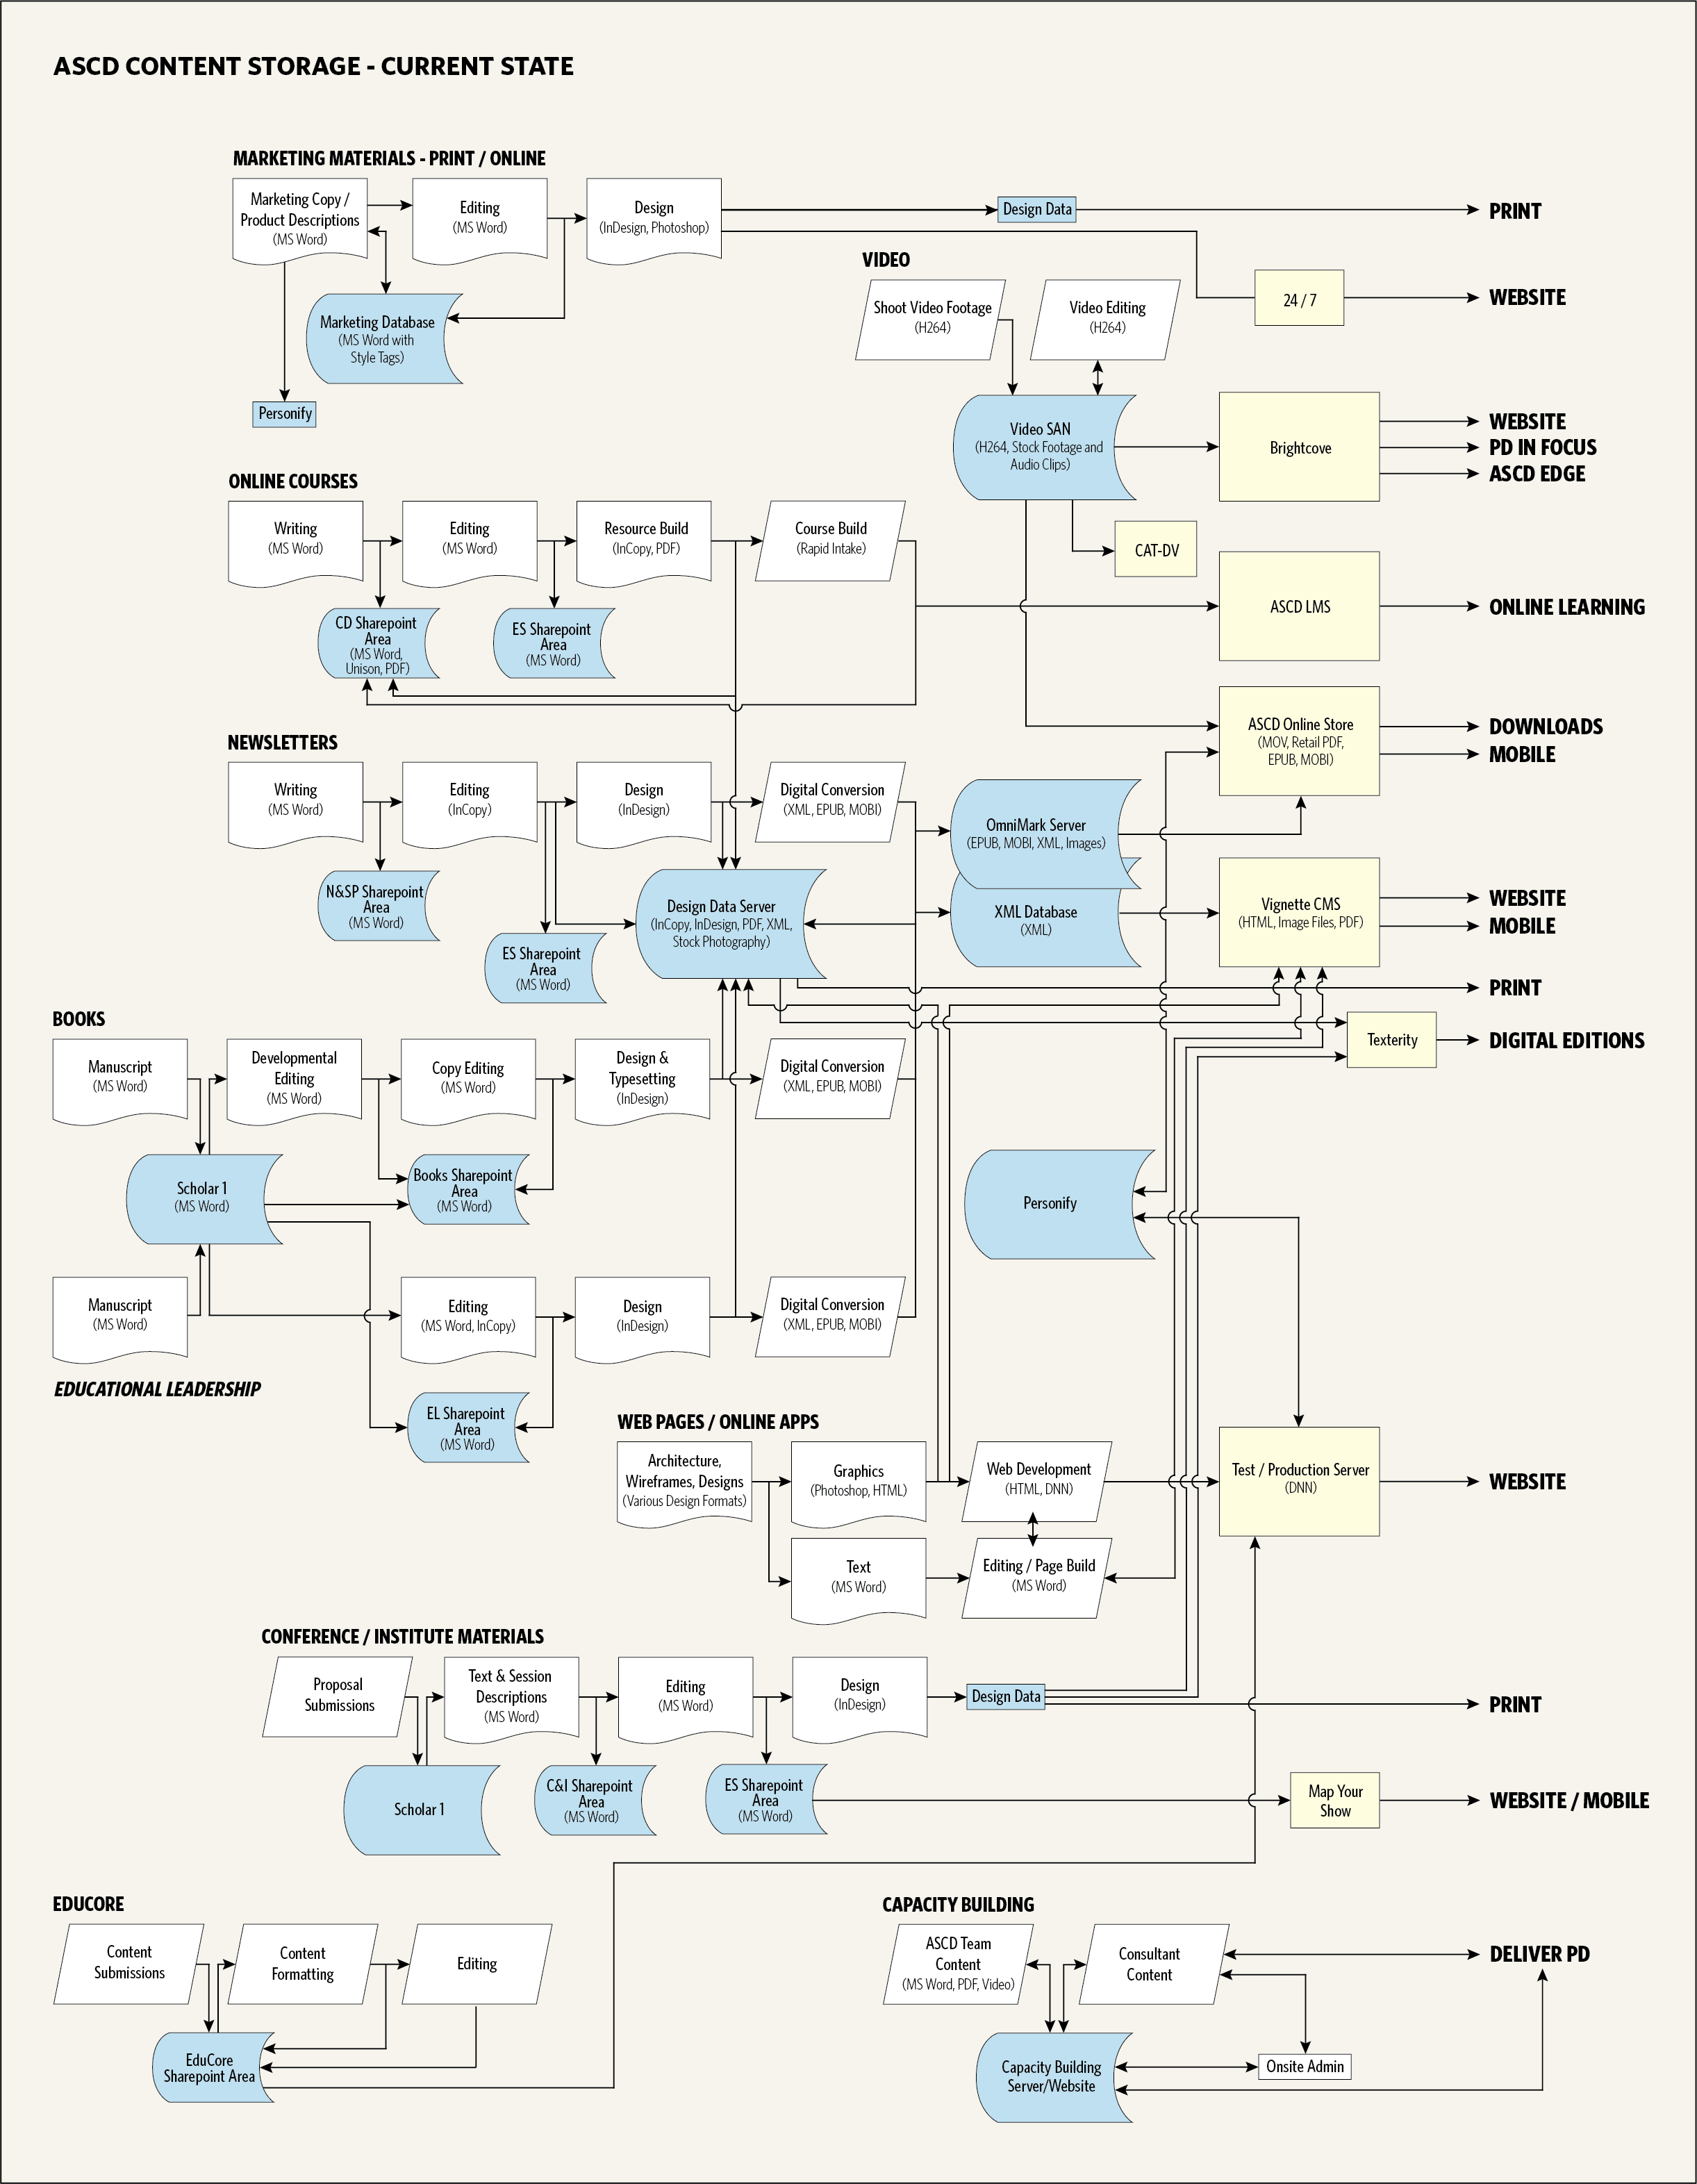
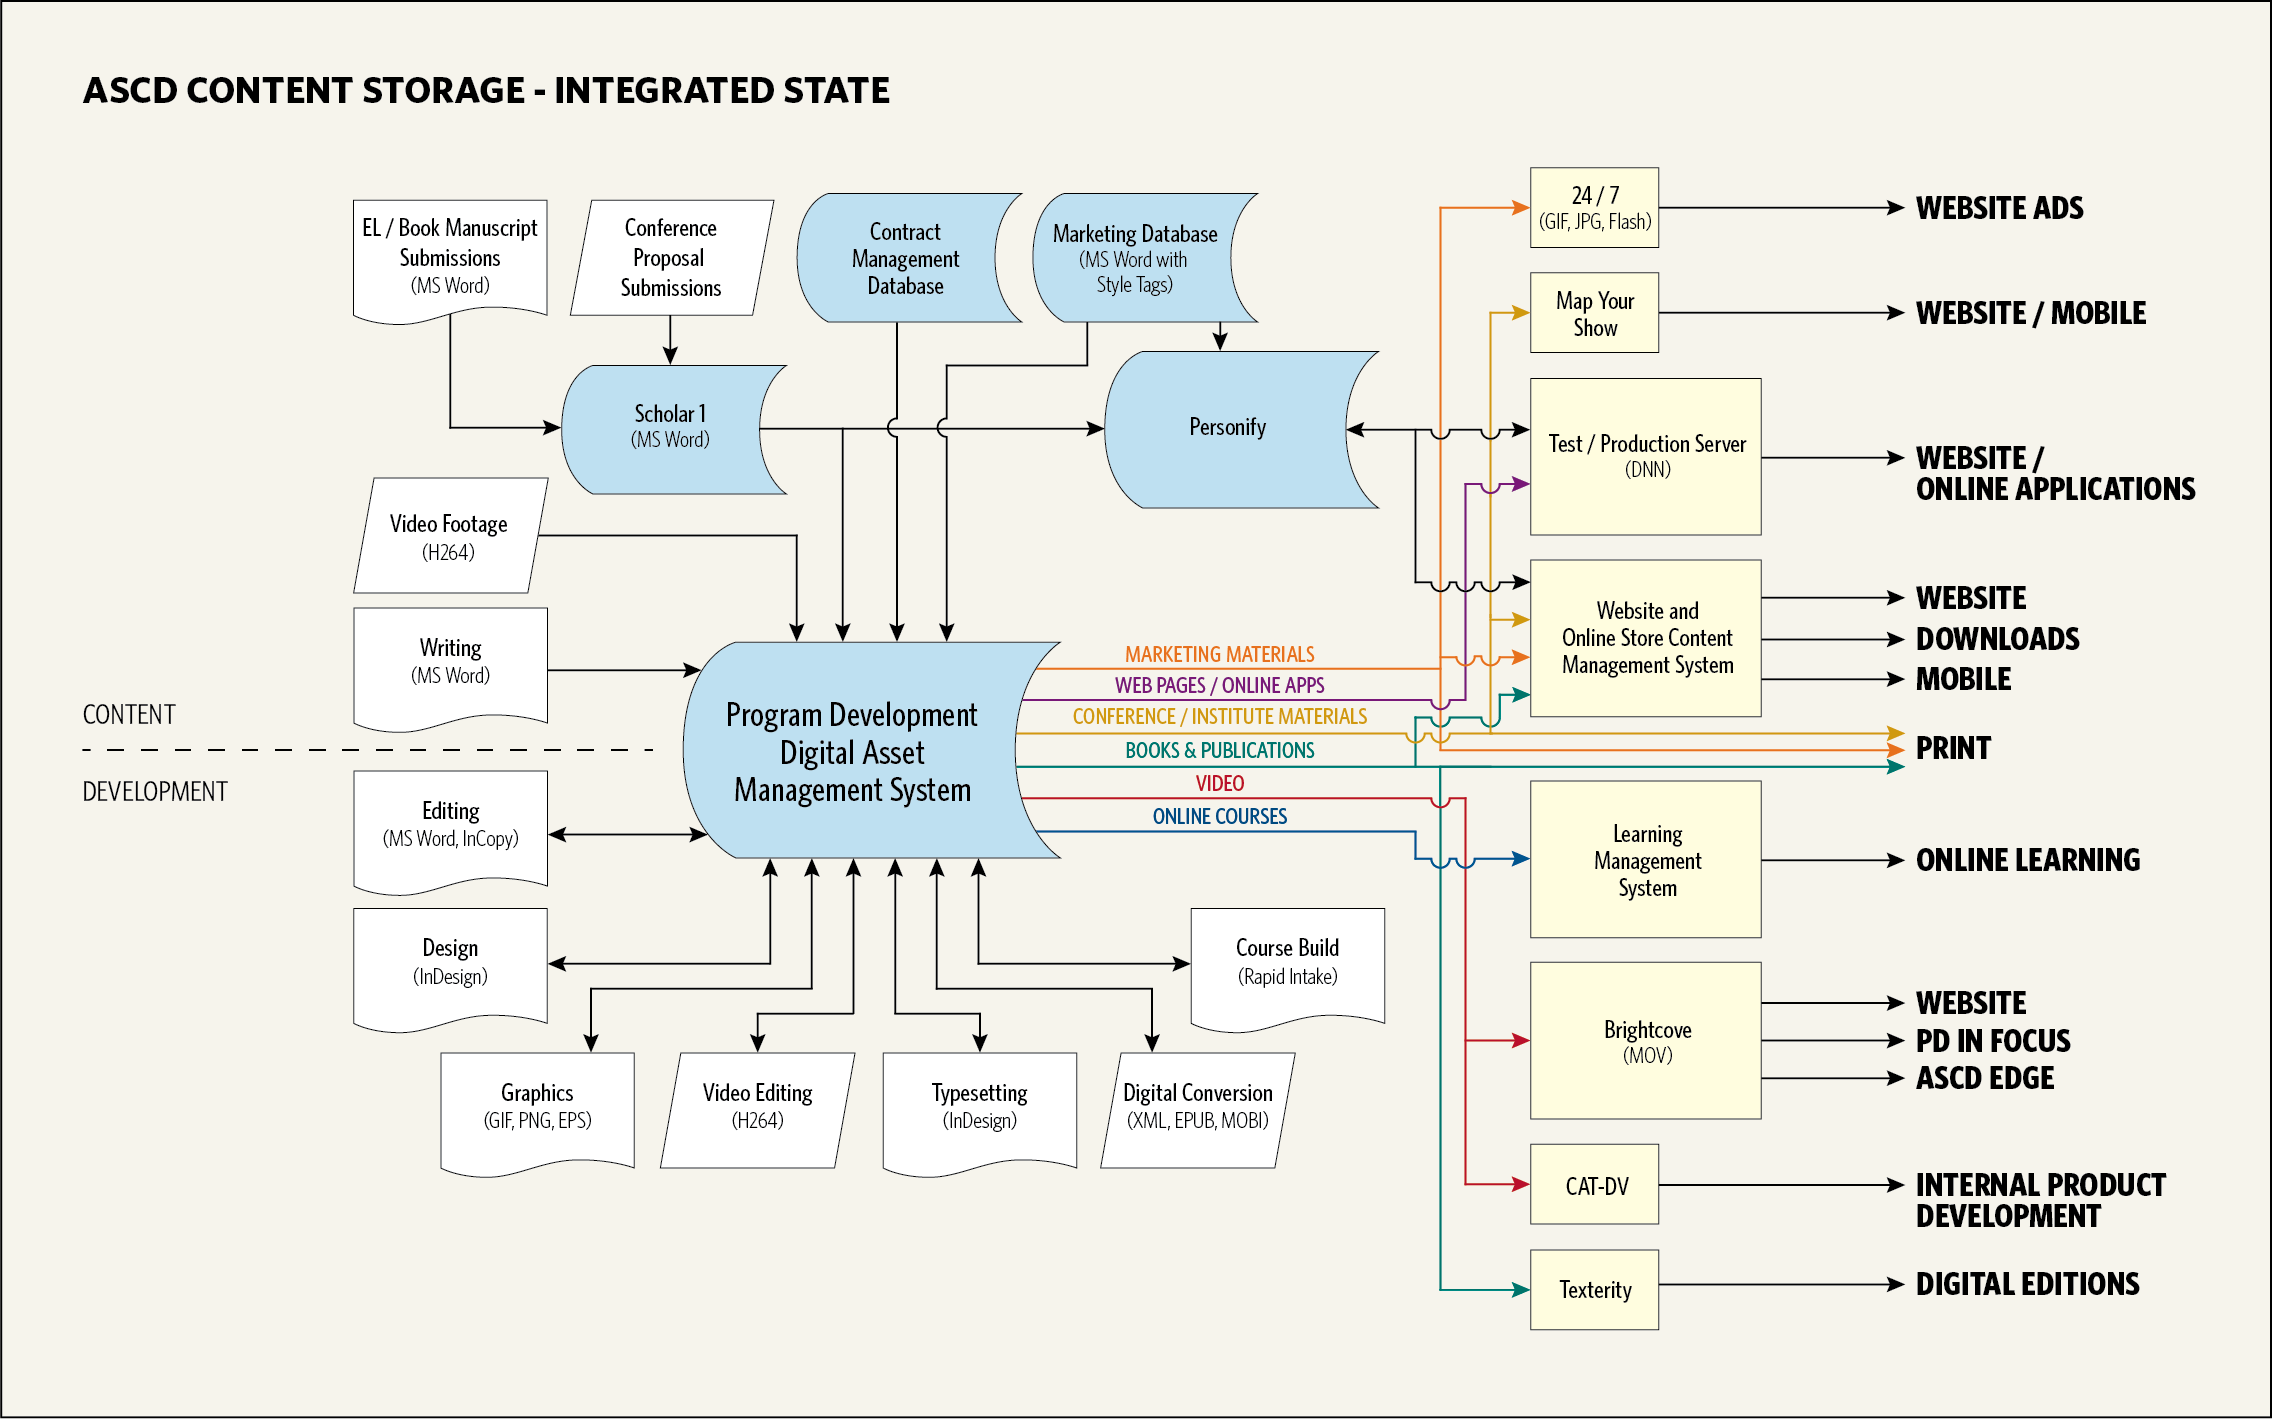
In preparation for implementation of a digital asset management system, I mapped out current content workflow and storage systems and how use of a DAM system could simplify and streamline the process.
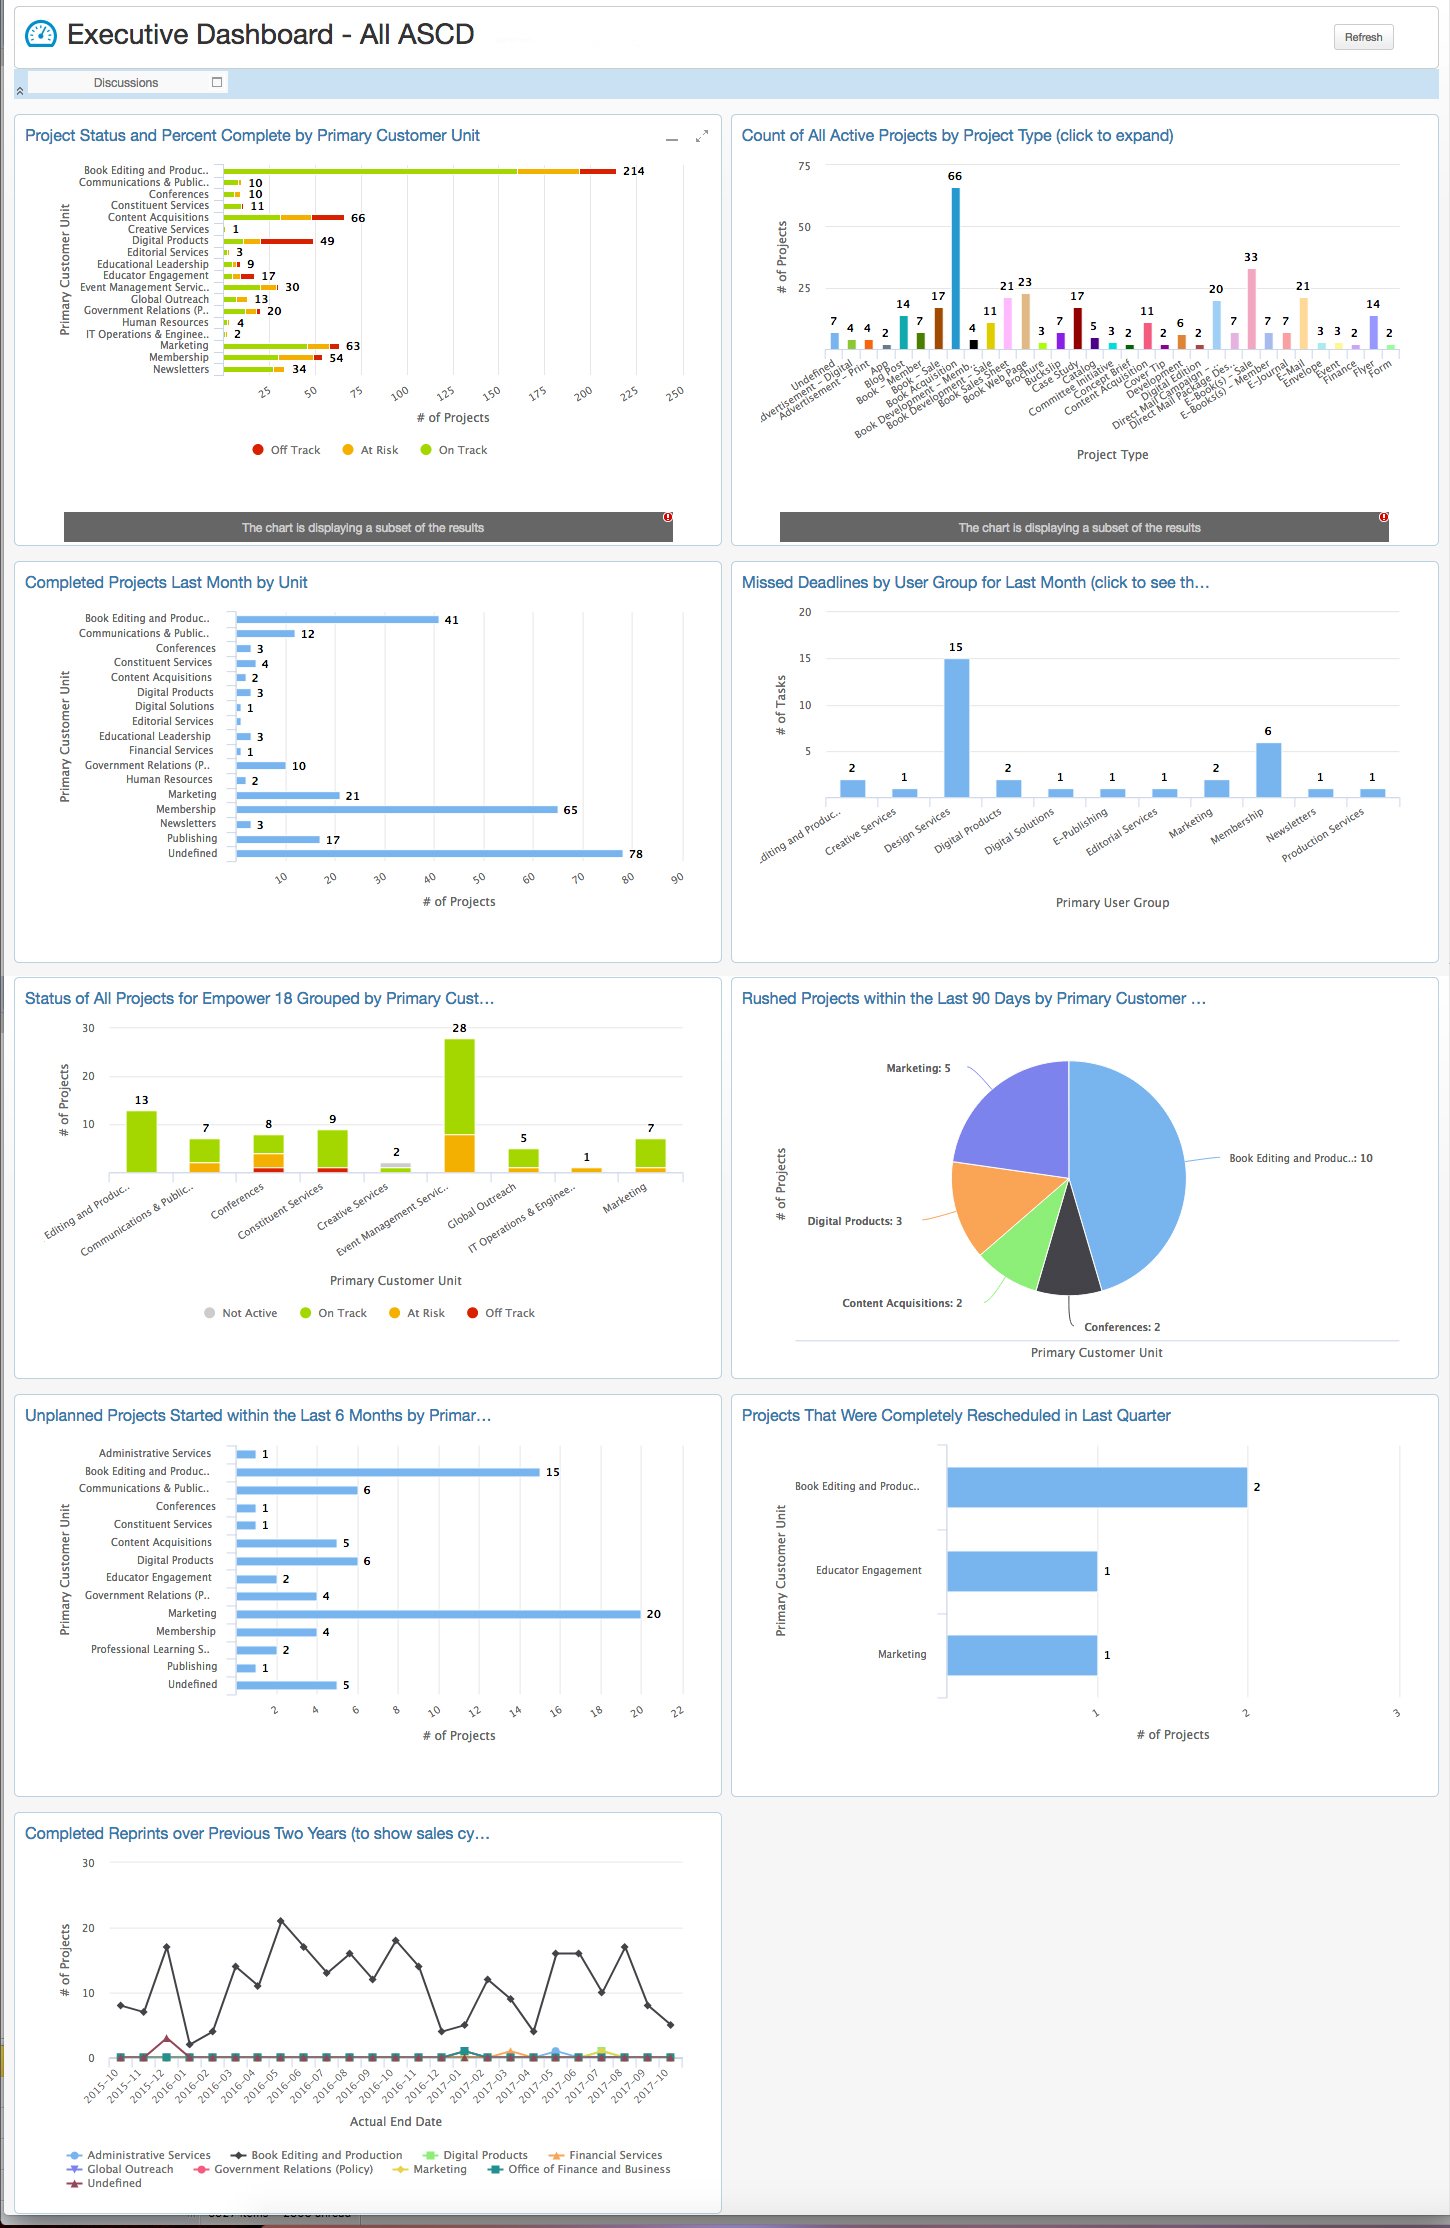
The executive dashboard presents project management data in real-time for company leadership. Graphs are compiled using data pulled from the Clarizen system used to schedule and track all projects.
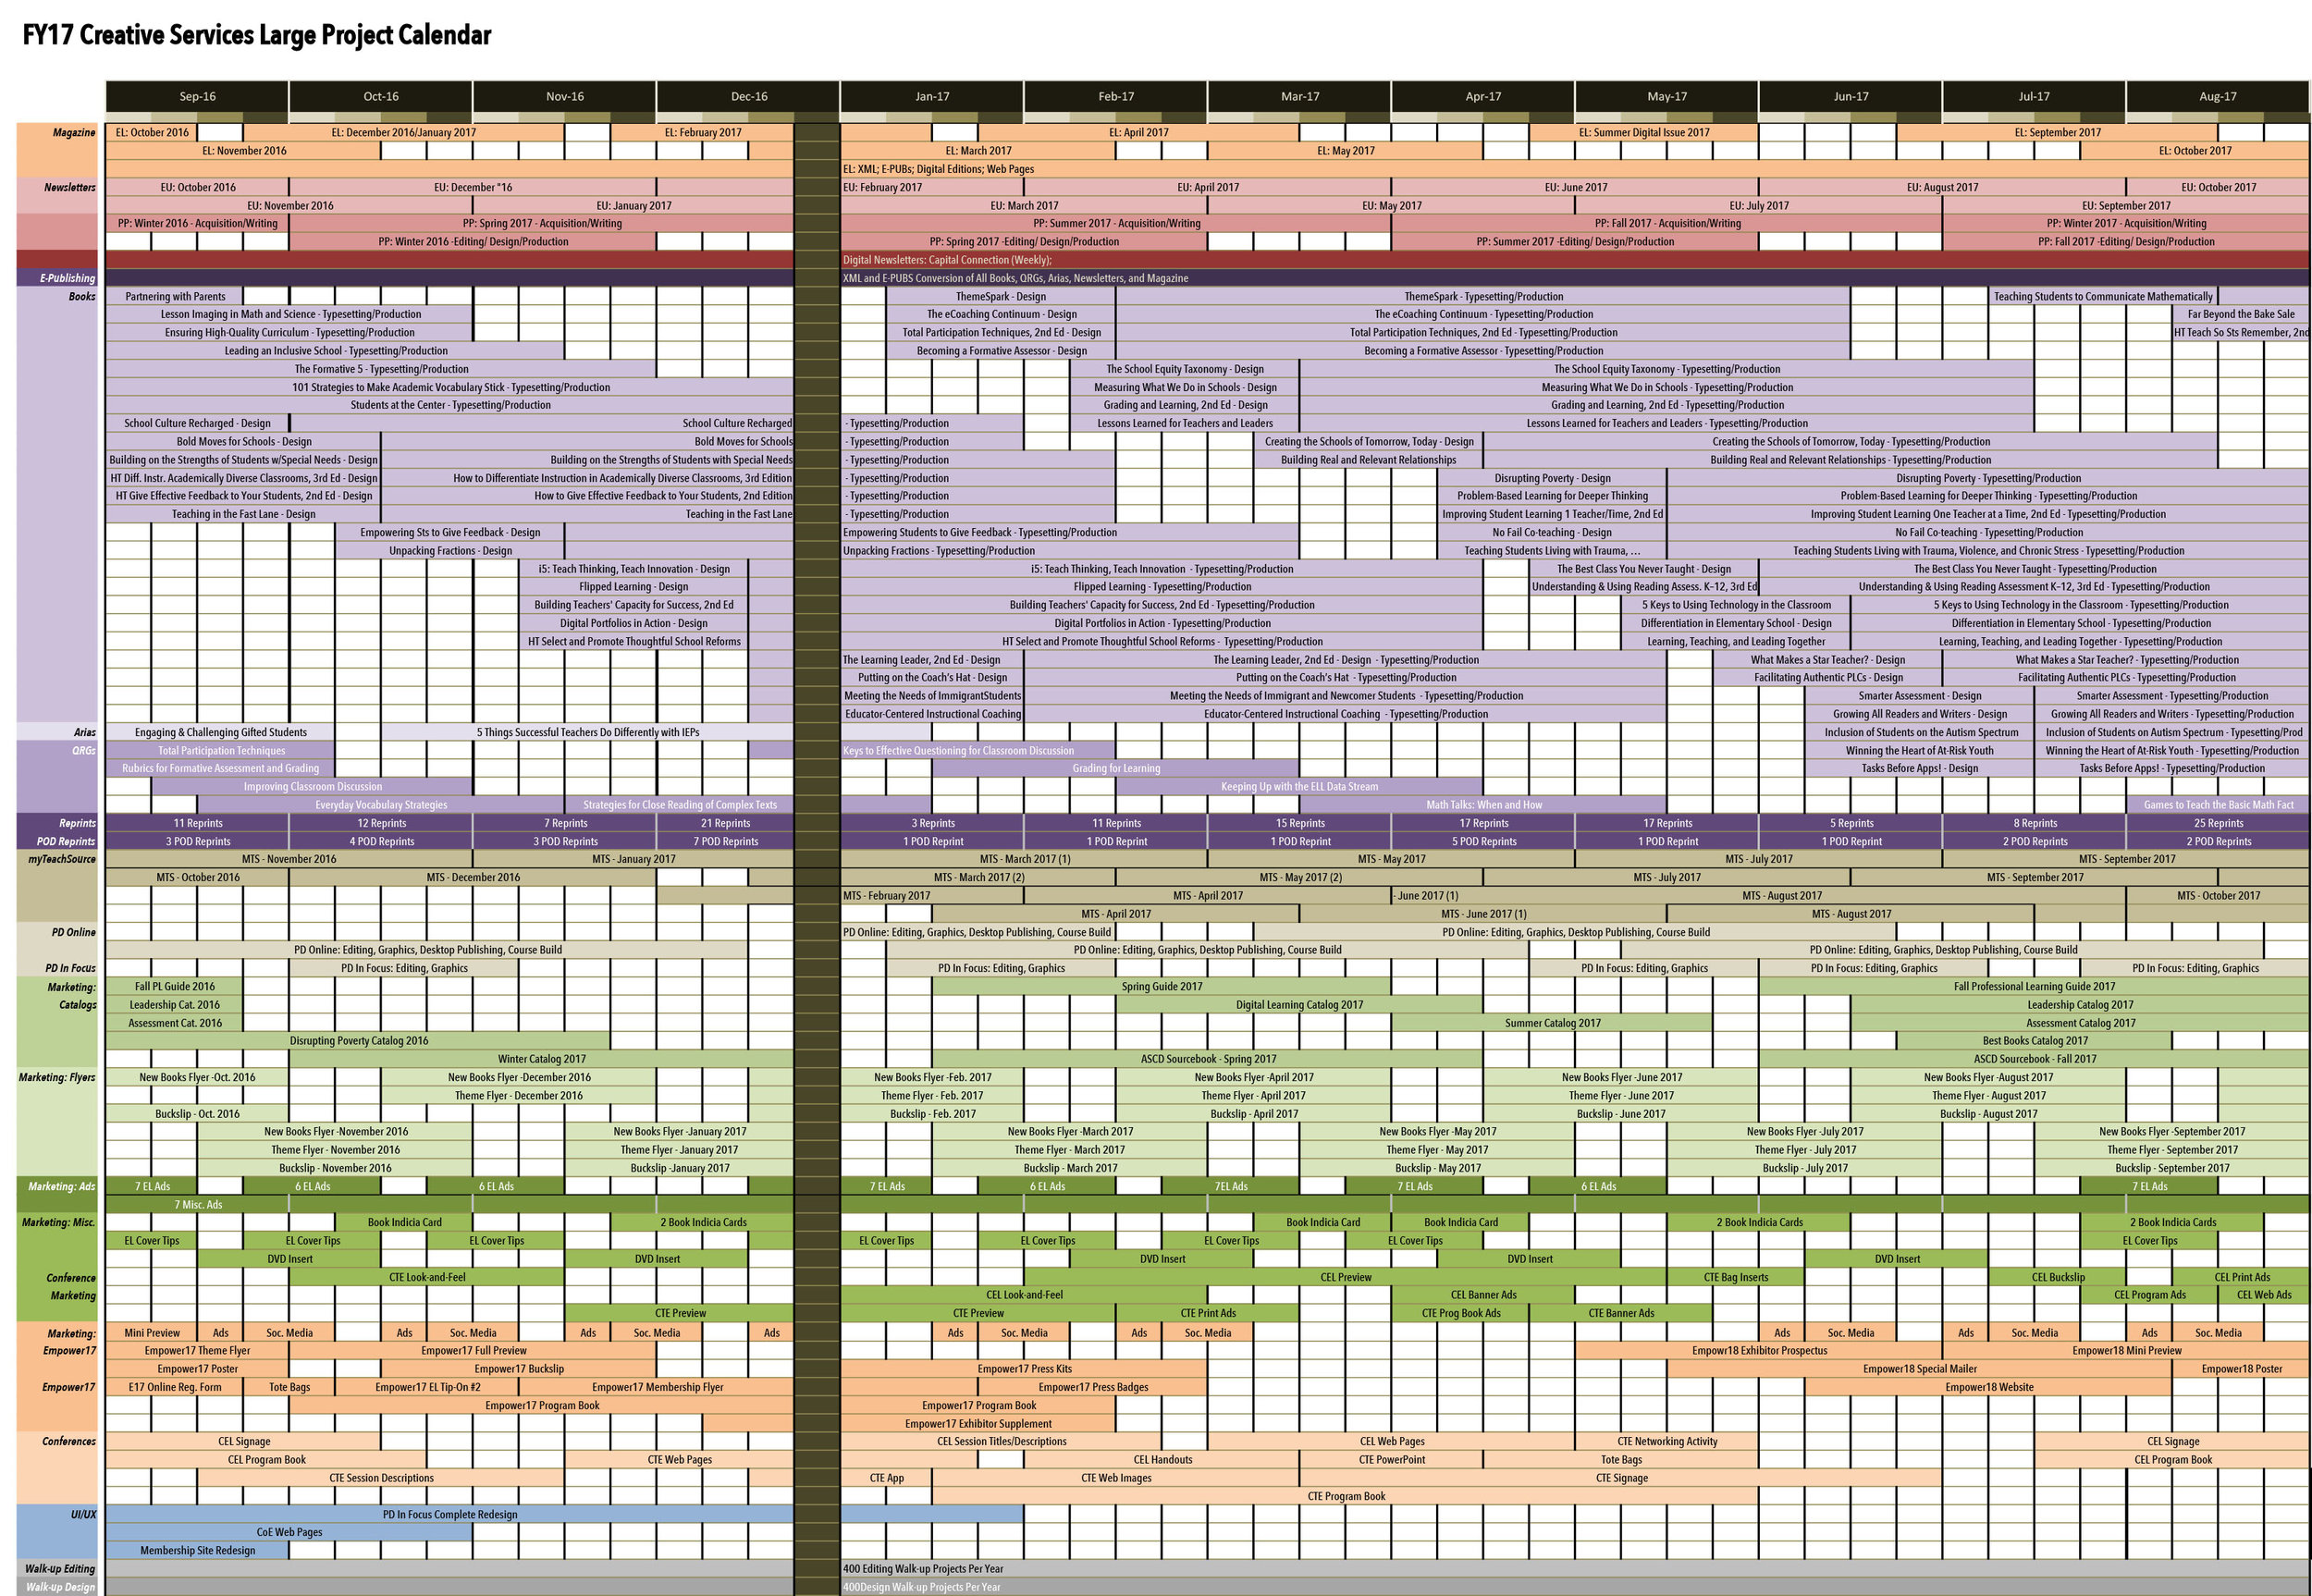
Large wall chart created at the start of each year to help spread workload more evenly and help plan resource allocation for peak periods.
Using schedule data puled from our project management system, I prepare a Gantt chart view for designers to follow.
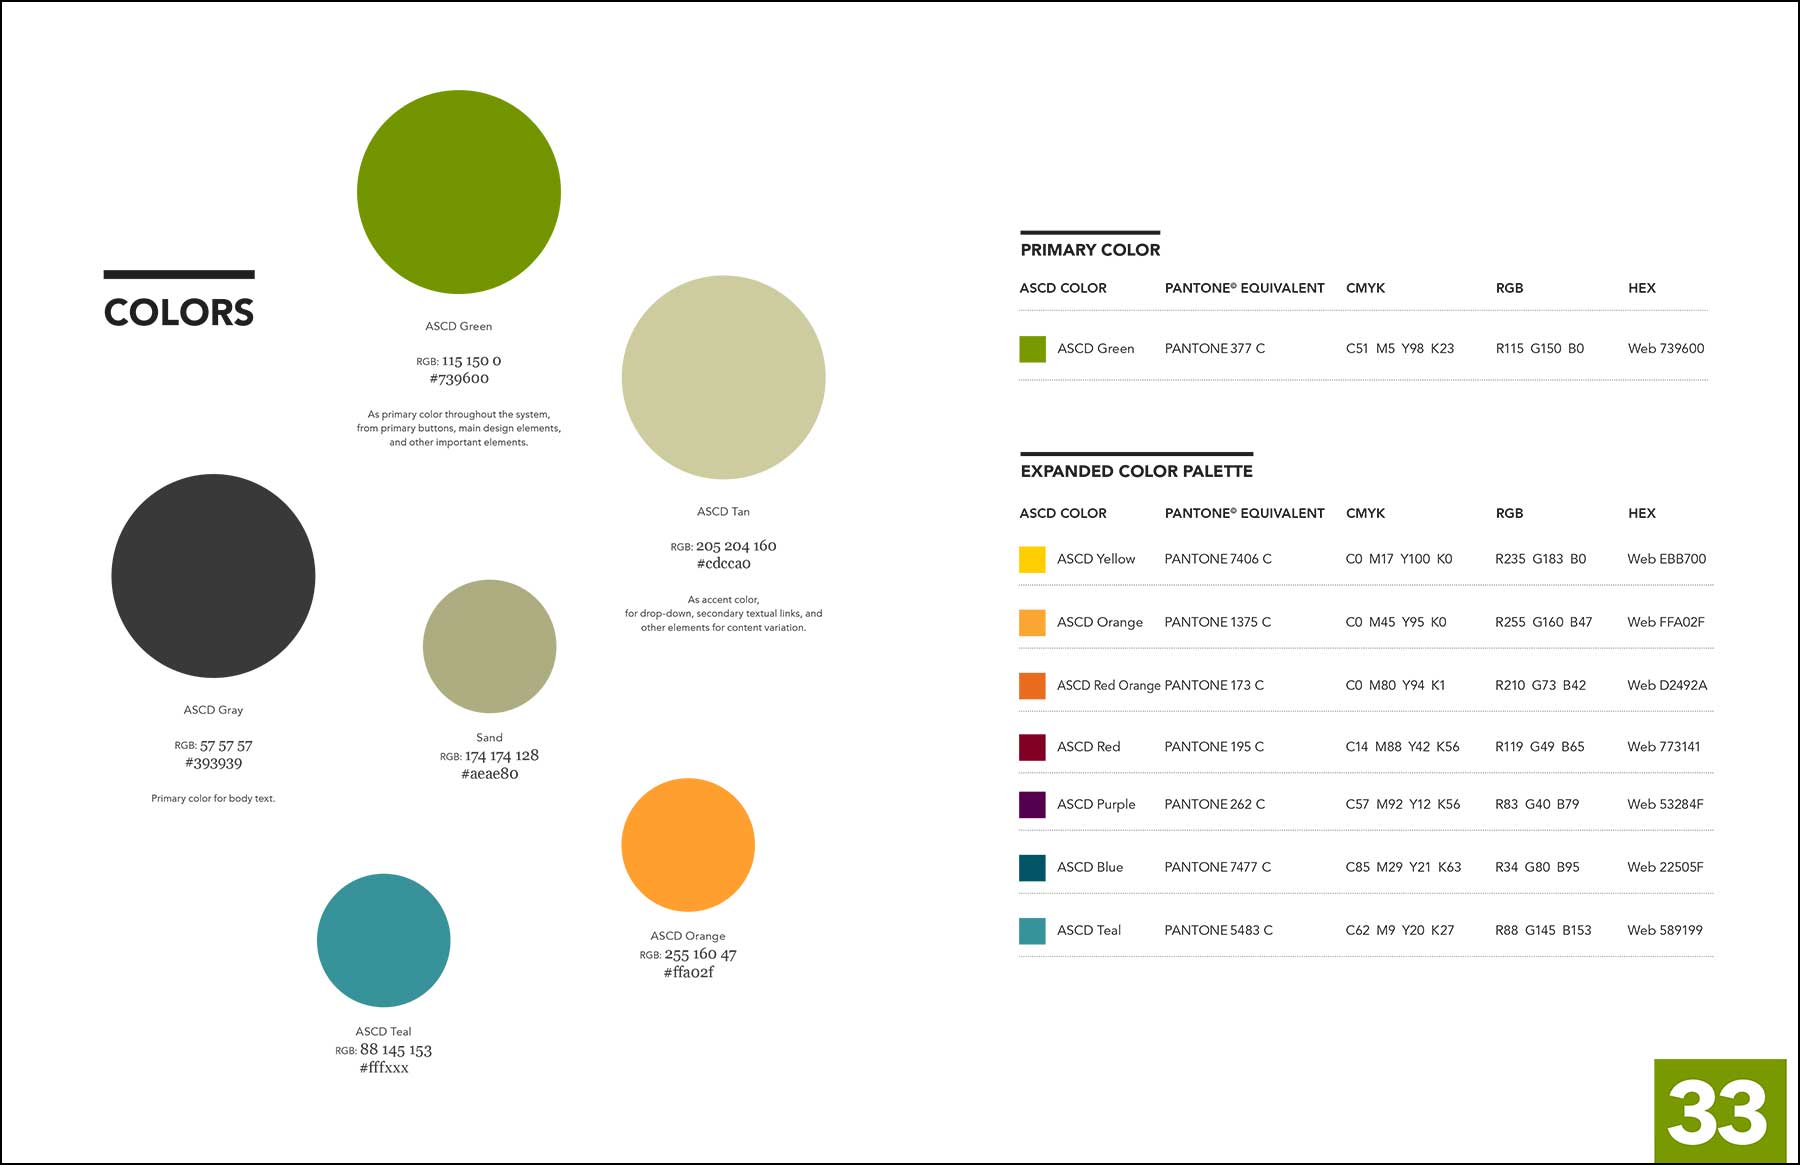
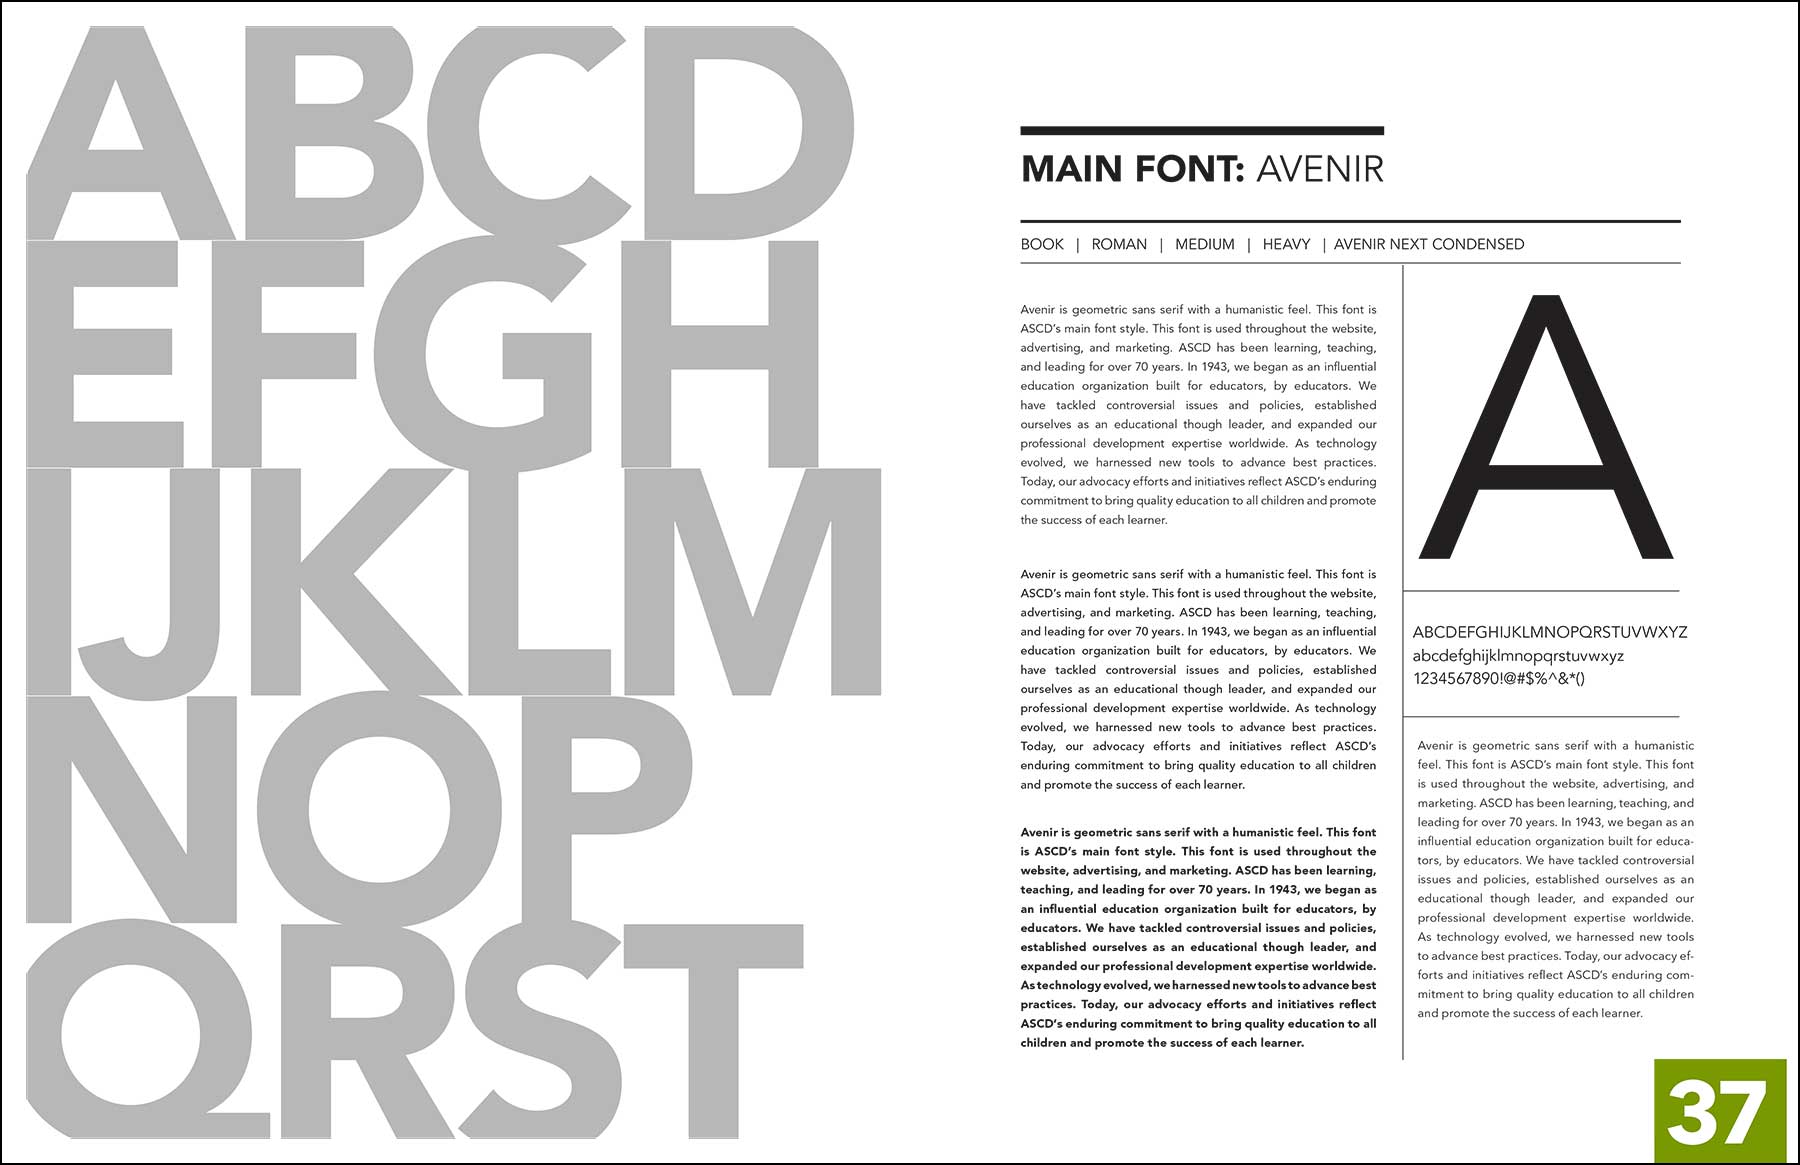
Worked closely with Marketing staff to develop new brand guidelines designed to inspire staff and foster better consistency in message and appearance across all ASCD communications and products.